Smyrna Vinings home sales were even hotter in May, which is remarkable considering the low inventory of homes we have for sale these days. For the homes that do stand out from the crowd, we are seeing very strong demand and buyer competition for those homes.
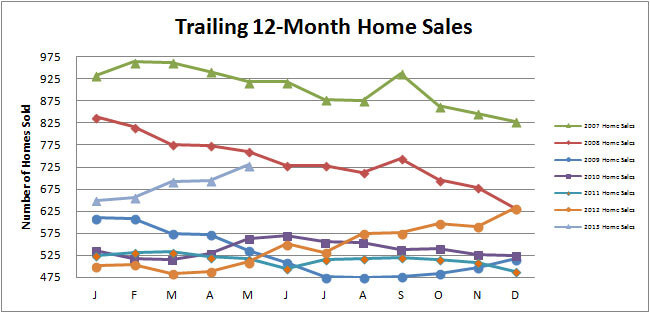
This chart shows you the past 12 months of home sales at any given point. As you’ll notice, the green bar is 2007 and we were selling a fair amount more homes in 2007. Sales dropped significantly in 2008, with the drop becoming more pronounced toward the last quarter of 2008. That would be the beginning of the financial meltdown. 2009 home sales started off about 32% off the level just two years previously in January 2007. We saw Smyrna Vinings home sales continue to drop in 2009, but then leveling off in late summer and actually seeing sales pick up toward the end of the year. Typically, you expect sales to be higher in the late Spring and early Summer, but that hasn’t been the case in 2007-2010.
We’ve really seen a lot of improvement in Smyrna Vinings home sales over the past year. Traditionally, home sales level off in the late Fall/Winter. However, that was not the case, particularly with strong December sales spilling into this Spring. Low interest rates and great prices continue to drive Smyrna Vinings home buyer demand. Pending contracts remain strong, so expect to see a continued strength in home sales in 2013. From a sales perspective, we’re nearly back to 2008 levels, which is quite impressive.
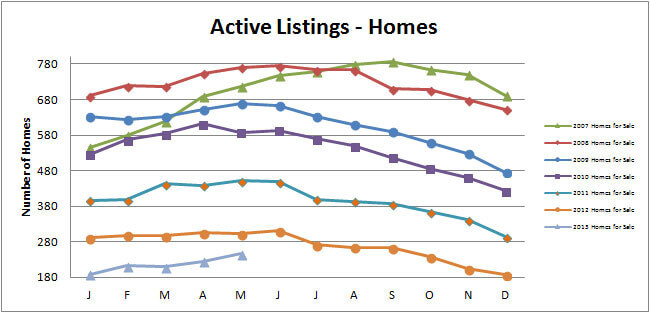
The Active Listings chart depicts Smyrna Vinings homes currently for sale. The general shape of the annual graphs are pretty consistent until we get to this year. What is different is that we’re just seeing a lot fewer homes on the market than in years. As a general rule, we’ve seen inventory increase in the April to June range and then see the amount of Smyrna Vinings homes for sale reduce towards the end of the year. This year, we’ve seen a small increase in inventory in February, but it’s starting from a historically low amount, so we still have the lowest inventory levels for February this year versus the past seven year. Whereas in past years homes may have taken 90 days to sell causing inventory levels to increase, we’re now seeing a lot of homes sell within two weeks. As the inventory shrinks, you will expect to see homes sell quicker as there are fewer homes for buyers to choose from and when the right home pops up, the patient buyers will be ready to jump. While sales have increased, it’s likely sales would be much higher if there were more homes for sale. There’s just not enough homes for buyers to choose from right now.
As sales are improving, we’re also seeing prices increasing as well. We’re going to continue to see more equity sellers in the market and fewer distressed properties as we move forward over the next couple years. This will result in continued low inventory levels as the number of equity sellers that can afford to sell will be outnumbered by buyers eager to take advantage of prices that are still depressed and interest rates that are phenomenal. If you’ve thought about selling and just aren’t sure, be sure to contact us or find out how much your home is worth. Less competition is a good thing if you’re ready to sell.
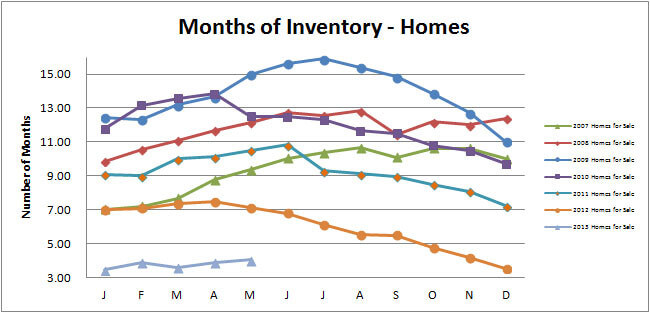
One other important statistic that we like to track is the overall health of the Smyrna Vinings home market. Months of inventory is a calculation that takes the current amount of homes for sale and divides that by the number of homes that have sold in the last 12 months. What the result means is if no more homes were listed, how many months would it take, based upon the past 12 months activity, to sell all the homes currently for sale.
A result of 6 months is considered a healthy market, less than 6 months a seller’s market and more than 6 months, a buyer’s market. What we can see from the chart above is that we have lower inventory levels right now than at any point in the past five years. Compare that with the highest amount of bloat and most severe buyer’s market in July of 2009 with significant improvement starting in mid-2010 and continuing through today.
In May, inventory levels increased slightly from last month to 4.04 months of inventory and have decreased significantly compared to 7.13 months just a year ago. Unlike 2012, we’re starting with very thin levels of inventory. We expect to inventory levels to remain low as long as interest rates remain low. Pending contracts at the end of May increased 8% over April, indicating even strong sales for June. Technically, we are now in a seller’s market based on current inventory levels. What this means as you will continue to see prices slowly rise from here as demand outpaces supply.
That is your Smyrna Vinings homes sales activity recap for May 2013. Hope that was helpful and don’t hesitate to contact us if we can help you sell your Smyrna Vinings home or find your new Smyrna Vinings home.
Click here if you’d like to know what your Smyrna Vinings homes is worth.
Click here to start your Smyrna Vinings home search.
[where: 30080]
[where: 30339]
[where: 30082]
[where: 30126]


