
Time for us to recap the April Smyrna Vinings home sales. The Smyrna Vinings home market continues it’s improvement and has proven to be a lot more resilient than a lot of areas around metro Atlanta. So let’s get to it and see what’s going on in the only market that matters most to you, your local Smyrna Vinings home market.

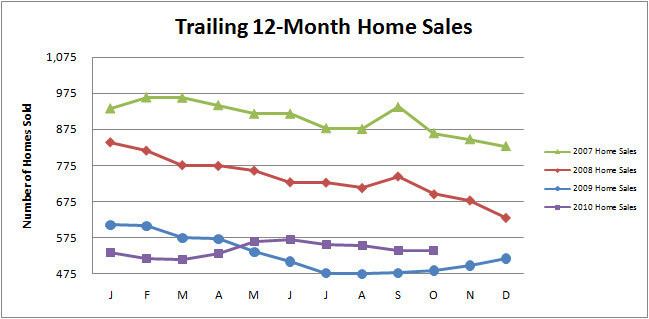
This chart shows you the past 12 months of home sales at any given point. As you’ll notice, the green bar is 2007 and we were selling a fair amount more homes in 2007. Sales dropped in 2008, with the drop becoming more pronounced toward the last quarter of 2008. That would be the beginning of the financial meltdown. 2009 home sales started off about 32% off the level just two years previously in January 2007. We saw Smyrna Vinings home sales continue to drop in 2009, but then leveling off in late summer and actually seeing sales pick up toward the end of the year. Typically, you expect sales to be higher in the late Spring and early Summer, but that hasn’t been the case in 2007-2009. The late surge in 2009 was due largely to first-time homebuyer incentives. In 2011, start off pretty similar to 2010, with a slight dip in April this year. While it may be quite awhile before we get back to the sales of 2007 and 2008, it would appear that over the last three years, we’ve seen very steady numbers and are created a base in terms of annual Smyrna Vinings home sales.

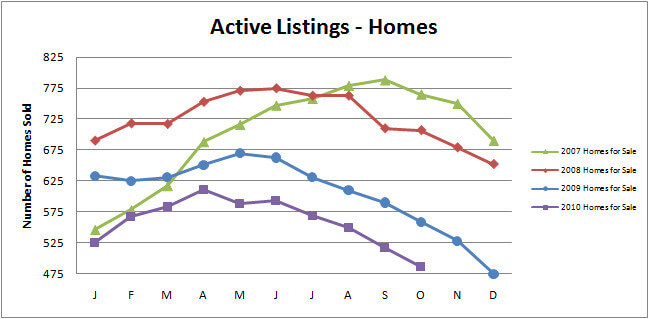
The Active Listings chart depicts Smyrna Vinings homes currently for sale. The general shape of the annual graphs are pretty consistent with what we would expect with more homes for sale during the late Spring and early Summer months. What is different is that we’re just seeing a lot fewer homes on the market this Spring than even in 2010. We’ve seen the inventory numbers drop off the last two years in the second half of the year and the inventory numbers really haven’t jumped up that much to start 2011. Some homeowners may feel like it’s time to stay put and some may feel like they just can’t sell in this market. 2011 inventory levels are at an all time-low for April compared to the last four years. If you’ve thought about selling and just aren’t sure, be sure to contact us or find out how much your home is worth.

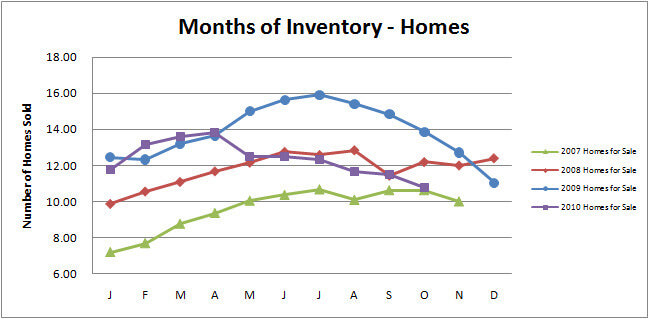
One other important statistic that we like to track is how we track the health of the Smyrna Vinings home market. Months of inventory is a calculation that takes the current amount of homes for sale and divides that by the number of homes that have sold in the last 12 months. What the result means is if no more homes were listed, how many months would it take, based upon the past 12 months activity, to sell all the homes currently for sale. A result of 6 months is considered a healthy market, less than 6 months a seller’s market and more than 6 months, a buyer’s market. What we can see from the chart above is that we were close to a seller’s market at the beginning of 2007, with the highest amount of bloat and most severe buyer’s market in July of 2009 with significant improvement in 2010 on into 2011. We’re still in a buyer’s market, but we’re at 10.1 months worth of inventory versus 14 months just a year ago. We have seen an increase to start 2011, which is expected as more homes list in Spring and early Summer and sales will lag, so nothing to be concerned about.
That is your Smyrna Vinings homes sales activity recap for April 2011. Hope that was helpful and don’t hesitate to contact us if we can help you sell your Smyrna Vinings home or find your new Smyrna Vinings home.
Click here if you’d like to know what your Smyrna Vinings homes is worth.
Click here to start your Smyrna Vinings home search.
[where: 30080]
[where: 30339]
[where: 30082]
[where: 30126]